NQ DayTrade Breakout
Most Trusted · 3+ Years Verified
Last updated: Mar 1, 2026Linear Scaling. Transparent Results.
The results shown are from 5 contracts. You can scale up or reduce contracts down linearly — every result adjusts proportionally.
1 Contract
$60,043
-$2,467 max intra-trade DD
5 Contracts
$300,215
-$12,335 max intra-trade DD
10 Contracts
$600,430
-$24,670 max intra-trade DD
* Hypothetical scaling example. Past performance is not indicative of future results.
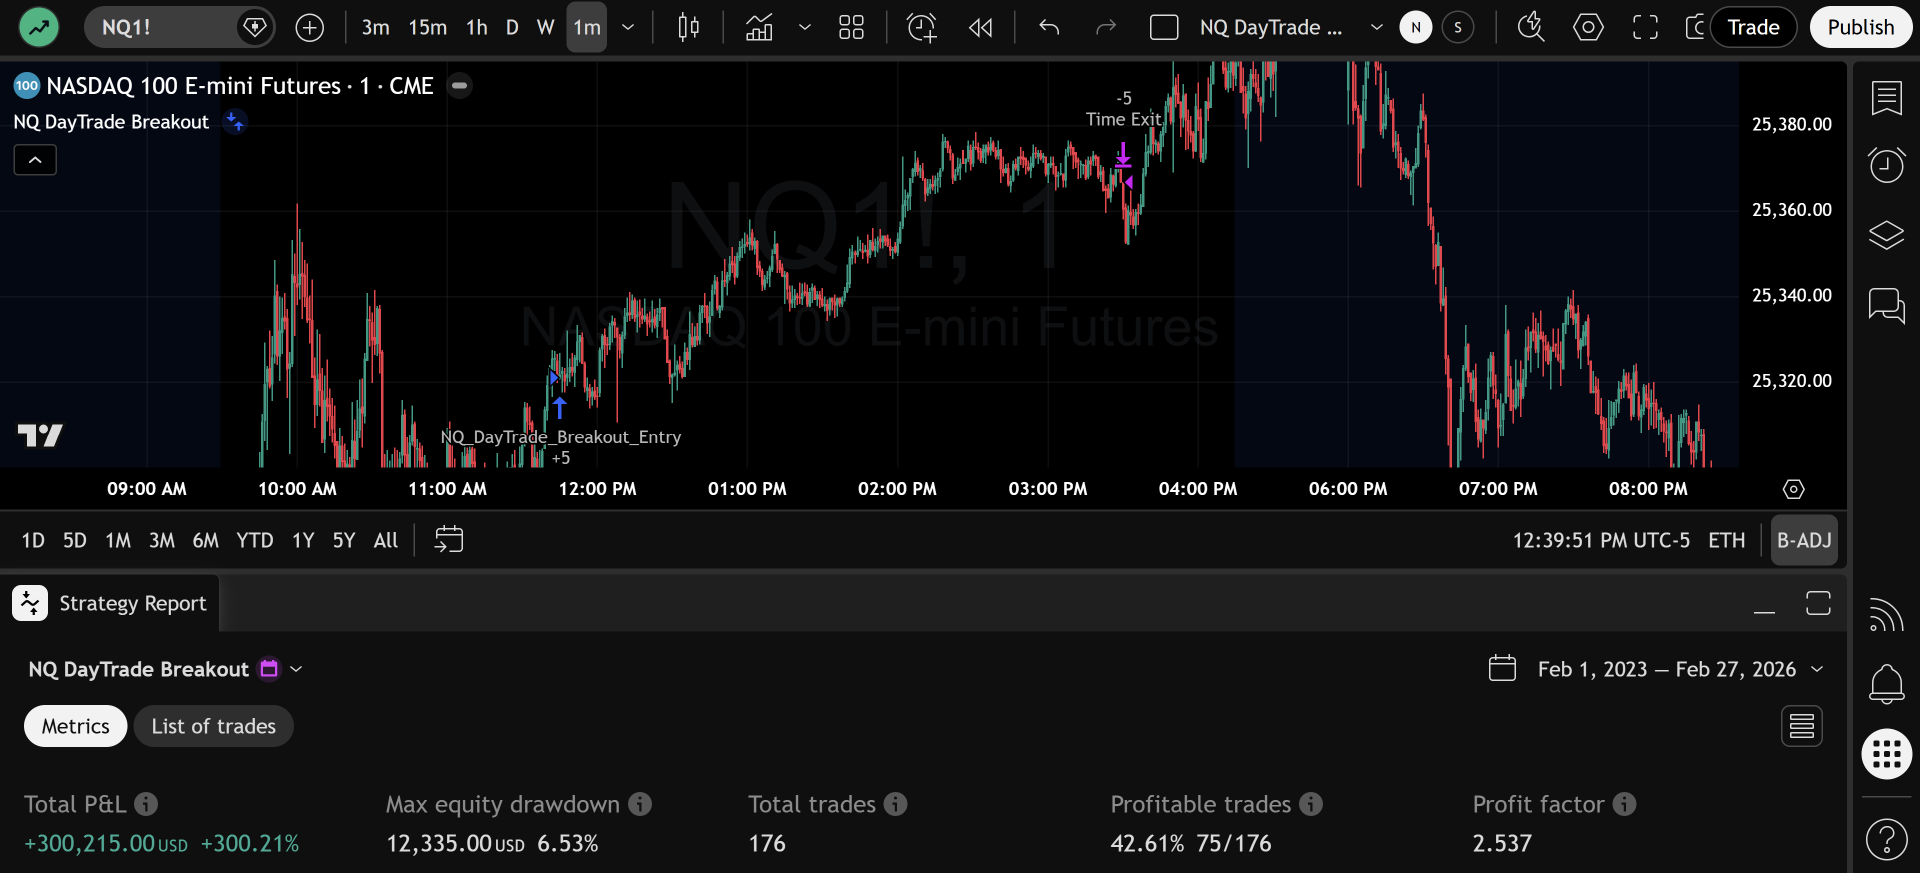
NQ DayTrade Breakout is our most trusted trading strategy. It has generated $300,215 in net profit per account across 176 trades over 3+ years (2023–2026), trading 5 contracts with a profit factor of 2.537 and max intra-trade equity drawdown of $12,335. Every position closes before the session ends — zero overnight risk, ever. Built for funded accounts, it runs natively on TradingView with full webhook-based automation support.
Equity Curve & Drawdown
Verified on TradingView
Live strategy report straight from TradingView — what you see is what you get.
Methodology
The strategy monitors key levels and identifies breakout conditions during regular trading hours. Entry signals are generated when price clears resistance with sufficient momentum, confirmed by volume and price action analysis. The system trades long-only, capitalizing on the Nasdaq's tendency for strong upward breakouts following consolidation at key levels. By design, the strategy is selective — averaging just 5 trades per month. Fewer trades means lower commission costs, less market exposure, and higher quality setups. Every entry is earned, not forced.
Risk Management — And Why Most Algo Strategies Fail
Every trade is protected by a dynamic stop loss that adjusts in real-time based on current market volatility and price action, ensuring stops are never too tight or too loose. Predefined profit targets lock in gains systematically, removing emotion from exits. The system maintains a max intra-trade equity drawdown of $12,335 and a max close-to-close equity drawdown of $12,130 on 5 contracts — the tightest risk profile relative to returns of any system we offer.
But risk management isn't just about what happens inside a trade — it's also about how the strategy itself is built. The algo trading space is full of systems that look incredible on paper but fall apart the moment real money is on the line. We've personally tested many of our competitors' strategies and found the same dangerous patterns over and over again.
Martingale and Position Averaging
Some developers use techniques that add into losing trades, artificially inflating win rates and trade counts. The backtest looks beautiful — until the inevitable blowup wipes out the entire account. Our strategy never adds to losers. One entry, one exit, every time.
Bar Close vs. Bar Open Execution
Many strategies execute trades "on bar close" in their backtests, but in live trading, orders only fill on the open of the next bar — at a completely different price. The backtest shows one thing; reality delivers another. Our strategy is designed so that what you see in the backtest matches what happens live.
Curve-Fitted Settings
Overoptimized parameters make a strategy look wildly profitable over the last 2–3 months. But once you subscribe and run a longer backtest, you discover it's been losing money for years. A good strategy should be consistent across time — not just cherry-picked windows. That's why we show 3+ years of results, not a convenient snapshot.
Intrabar Stop Losses and Profit Targets
This is one of the most common and least understood issues. Intrabar data creates a polished backtest that looks flawless, but in live trading, orders fire at different times and prices. Apply even the slightest stress testing and the whole thing collapses.
Hidden Stats and Tiny Average Trades
Many developers hide key metrics like average trade size. Some show an average trade of $50 or less on NQ — a number so small that slippage, commissions, and execution latency make it completely unviable on a retail platform like TradingView. You'd need professional-grade direct market access and colocated servers to even have a chance. Our average trade is $1,706 on 5 contracts — a real, executable edge.
We built our strategy with none of this trickery.
Our system is highly selective — sometimes trading only twice in a month. We prefer high-precision sniper entries over the "spray and pray" approach our competitors use. Every stat on this page is real, includes commissions, and comes from a 5-contract baseline you can verify yourself. This strategy is for funded traders who want a proven system to build their accounts over time — not traders looking to get rich quick. Real wealth is built with discipline, consistency, and time.
* Trading futures involves substantial risk of loss. Please review our Risk Disclosure before subscribing.
Key Features
- 🏆 Most trusted strategy — 3+ years of verified performance
- 💰 3+ years of verified performance data
- 📊 5-contract results including commissions — no inflated numbers
- 📈 Linear scalability — results scale proportionally with contract size
- Daytrade only — all positions closed before market close, zero overnight risk
- Profit factor of 2.537 — every $1 risked generates $2.54 in profit
- Max intra-trade equity DD of $12,335, max close-to-close equity DD of $12,130
- Only 5 max consecutive losers in 176 trades — unmatched consistency
- Breakout detection with confirmation filters
- Long-only strategy designed for NQ's upward bias
- TradingView native — supports alert-based live trading automation
- 🔗 Run multiple funded accounts simultaneously
- Built for funded accounts — tight drawdown, disciplined execution
- ✅ Verified prop firm payouts from real funded accounts — see proof